
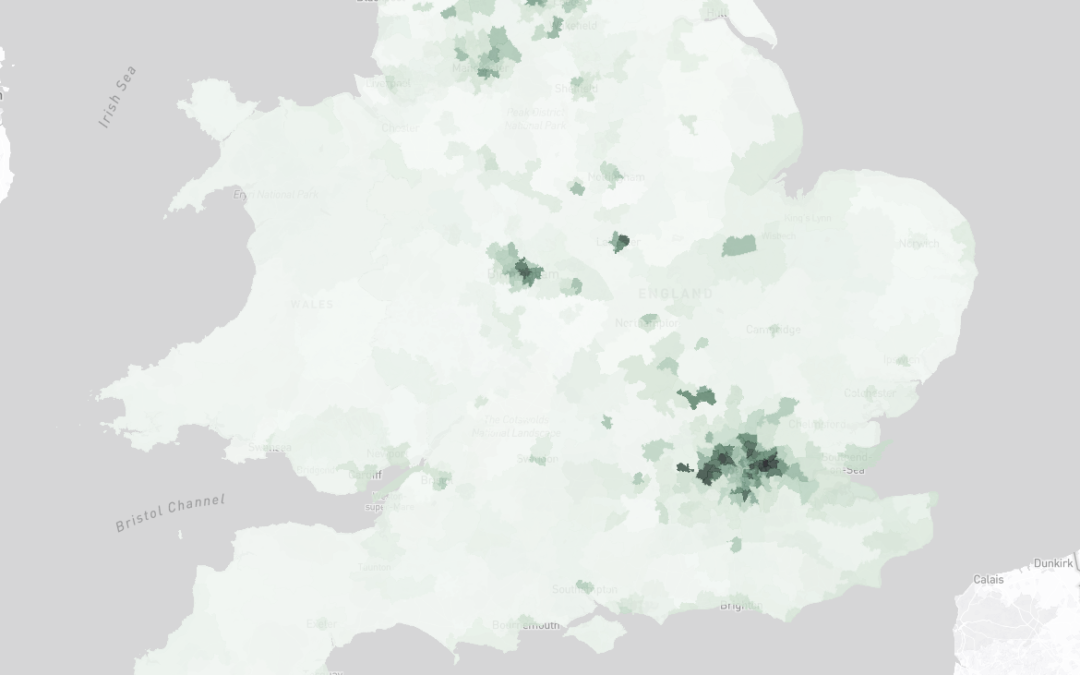
Check out our new interactive map that shows the geographical distribution of overcrowded households in England and Wales.
Having too few homes in our big cities means that a great number of young people and families live in overcrowded conditions.
For the first time, our new map visualises the uneven geographic distribution of overcrowded households across England and Wales, measured at both constituency and LSOA levels. The map also looks at the share of overcrowded homes and homes at social rent.
Browse the map below to discover the scale of overcrowding across many of our big cities where people want to live most.
The top ten most overcrowded constituencies
- East Ham: 26.2% of households are overcrowded.
- Brent West: 20.1% of households are overcrowded.
- West Ham and Beckton: 19.7% of households are overcrowded.
- Barking: 19.2% of households are overcrowded.
- Ilford South: 18.9% of households are overcrowded.
- Bethnal Green and Stepney: 18.2% of households are overcrowded.
- Feltham and Heston: 17.9% of households are overcrowded.
- Hayes and Harlington: 17.6% of households are overcrowded.
- Tottenham: 17.5% of households are overcrowded.
- Stratford and Bow: 16.9% of households are overcrowded.
See how your constituency compares by using the map!
Recent Comments